

Union Leader Celebrates Failing School’s Performance
NEA president praises Flint Northwestern moving from the lowest 5 percent of schools to the lowest 6 percent


Flint Northwestern High School’s academic performance is not the type most would want to celebrate. The school has consistently been among the worst performing in the state. Yet in a recent visit, the leader of the National Education Association told union members at the school that Northwestern "did it right."
NEA President Lily Eskelsen Garcia stopped at Flint Northwestern as part of a statewide tour on Sept. 24 to celebrate it being moved off the Michigan Department of Education "priority schools list." The state applies this label to the lowest performing 5 percent of schools, which makes them subject to increased supervision. When Flint Northwestern finished among the bottom 6 percent instead, it dodged this status by two percentage points.
Academic outcomes at the school show little cause for celebration. Flint Northwestern had a four-year graduation rate of 66 percent in 2012-13 — its lowest in five years. In 2010-11, it was ranked among the bottom 13 percent of Michigan public schools. In 2011-12, it fell to the bottom 8 percent, and in 2012-13 joined the lowest 5 percent. In that year, 17 percent of students scored proficient on the Michigan Merit Exam reading test. The school's ranking in the bottom 6 percent this year represents a marginal improvement after three years of decline.
Yet during her visit, Eskelsen Garcia said, “This is a school that did it right.” She told school employees, "To me, a really good school is one that's involving the whole community in caring for kids,"
"We're moving up!" a Northwestern teacher said, according to a Michigan Education Association press release.
Flint Northwestern’s students struggle with poverty: 82.4 percent are eligible for a means-tested federal free lunch program. But the school’s poor performance cannot be blamed on low incomes. While the state’s ranking system does not adjust for student socioeconomic status (SES), one developed by the Mackinac Center for Public Policy does — and based on four years of data Flint Northwestern still received an “F.”
“You have a school that is failing to graduate one-third of its kids, that has received very low rankings by both the Michigan Department of Education and the Mackinac Center,” said Audrey Spalding, director of education policy at the Mackinac Center. “This is a school that is failing its community.”
Eskelsen Garcia’s visit to Flint Northwestern came a few weeks after the national union’s annual meeting, where it also recognized the school for coming off the state’s low-performing watch list. The union’s state chapter, the Michigan Education Association, has also claimed credit for the marginal gain.
The high praise from the leader of the largest union in the country comes at a time when the MEA is calling for more accountability — not for conventional schools like Flint Northwestern, but for charter public schools.
Gary Naeyaert, executive director of the Great Lakes Education Project, said there is cause for celebration in Flint. Not at Northwestern, however, but at the International Academy of Flint, a K-12 charter public school less than 10 miles away from Northwestern. An even larger proportion of this school’s students struggle with low income backgrounds, with 88.3 percent eligible for the free lunch program.
Yet, International Academy of Flint finished in the 44th percentile of the state’s "Top To Bottom" list in 2013-14 (compared to Flint Northwestern’s 6th percentile) and had a higher graduation rate (72.7 percent). The charter public school’s students outperformed Flint Northwestern on the Michigan Merit Exam, with 42 percent scoring proficient in high school reading (compared to the conventional public school’s 17 percent). International Academy also received an “A” on the Mackinac Center’s SES-adjusted report card in 2012.
Flint Community Schools Superintendent Larry Watkins Jr. did not respond to a request for comment.
Editor's Note: This story has been slightly modified.
~~~~~
Report Card Compares High School Test Scores and Adjusts for Poverty
Charters Outperform Conventional Schools
Charter Schools Serve More Low-Income Students Than Conventional Districts
Michigan Capitol Confidential is the news source produced by the Mackinac Center for Public Policy. Michigan Capitol Confidential reports with a free-market news perspective.
Want to support our work?
Help us tell the free market, limited government side of the story. Support Capitol Confidential today
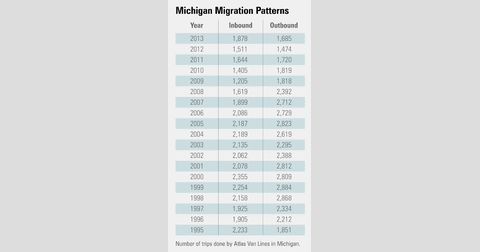
 Michigan ranked 34th for population growth over four years
 Taxes matter to Michigan’s population growth
 If you seek a pleasant peninsula, U-Haul will take you to Florida